| 일 | 월 | 화 | 수 | 목 | 금 | 토 |
|---|---|---|---|---|---|---|
| 1 | 2 | 3 | ||||
| 4 | 5 | 6 | 7 | 8 | 9 | 10 |
| 11 | 12 | 13 | 14 | 15 | 16 | 17 |
| 18 | 19 | 20 | 21 | 22 | 23 | 24 |
| 25 | 26 | 27 | 28 | 29 | 30 | 31 |
- nrcemotionlexicon
- htmltags
- 티스토리챌린지
- 데이터분석
- 래피드마이너
- agglomerative clustering
- 통계개념
- causalanalysis
- 커스텀오퍼레이터
- LDA
- RapidMiner
- 채용공고분석
- pythonlearner
- 데이터
- 머신러닝
- GoEmotions
- 데이터크롤링
- llma
- sentimentanalysis
- customeoperator
- 오블완
- 감성분석
- datacrawling
- 인과분석
- featureimportance
- 올라마
- 토픽모델링
- customoperator
- 파이썬러너
- 텍스트마이닝
- Today
- Total
마이와 텍스트마이닝
4차 산업혁명 동향: 채용 공고 분석 본문
이 연구는 싱가포르, 말레이시아, 필리핀, 인도네시아의 채용 공고에서 4차 산업혁명(4IR) 동향을 분석하고, 키워드 빈도 분석과 다양한 그래프 설정을 통해 결과를 시각화했습니다. 결과는 싱가포르가 4IR 기술에 대한 강한 의지를 보이며 두드러진 위치를 차지하고 있음을 강조합니다. 말레이시아와 필리핀도 4IR 관련 역량에 적극 참여하고 있지만, 인도네시아는 4IR 기술을 채용 시장에 통합하는 초기 단계에 있는 것으로 보입니다. 이러한 결과는 동남아시아의 4IR 동향을 이해하고 미래의 고용 패턴을 예측하는 데 도움을 줍니다.
- 우선 데이터 전처리 작업은 다음과 같습니다:
1. 가장 많은 채용 공고가 있는 10개 역할에 따라 데이터셋 필터링
2. 결측값 확인
3. 중복 데이터 확인
4. Stopword list 확장 및 필터링
5. 줄 바꿈 캐릭터 제거 ('\n')
6. 텍스트를 소문자로 변환
7. 텍스트에서 URL 제거
8. 텍스트에서 태그 제거
9. 구두점 제거 및 공백 추가
10. 리스트 항목 병합 및 공백 추가
11. Stopwords 다시 제거
12. 이모지 제거
import pandas as pd
import numpy as np
from cleantext import clean
import emoji

df_2 = pd.read_csv('EAsia.csv')df_2['position'].value_counts().head(20)Software Engineer 1710
Business Analyst 1277
Software Developer 1001
Project Manager 967
Java Developer 823
Network Engineer 794
DevOps Engineer 770
Senior Software Engineer 712
Full Stack Developer 702
Web Developer 646
IT Executive 639
IT Project Manager 600
Data Engineer 534
System Engineer 532
Programmer 473
Database Administrator 471
IT Business Analyst 457
System Analyst 438
IT Support 385
IT Manager 375
Name: position, dtype: int64positions = ['Software Engineer','Business Analyst','Software Developer','Project Manager','Java Developer', 'Network Engineer','DevOps Engineer','Senior Software Engineer','Full Stack Developer',
'Web Developer','IT Executive','IT Project Manager','Data Engineer','System Engineer',
'Programmer','Database Administrator','IT Business Analyst','System Analyst','IT Support','IT Manager']
df = df_2[df_2['position'].isin(positions)]df.shape(14306, 4)df['country'].value_counts()Singapore 4242
Malaysia 3832
Philippines 3792
Indonesia 2440
Name: country, dtype: int64
2. 결측값 확인
missing_values = df.isna().sum()
print(missing_values)
position 0
country 0
job_description 0
jdate 0
dtype: int64
3. 중복 데이터 확인
duplicate_rows = df[df.duplicated()]
print("Duplicate rows:")
print(duplicate_rows)
Duplicate rows:
Empty DataFrame
Columns: [position, country, job_description, jdate]
Index: []
4. Stopword list 확장
- 공고에서 자주 나오는 'company', 'job', 'work', 'day', 'good', 'apply', 'need', 'description', 'include', 'people', 'employee' 등의 단어를 스톱워드에 추가
# NLTK Stop words
from nltk.corpus import stopwords
stop_words = stopwords.words('english')
sw_list = ['company', 'job', 'work', 'day', 'good', 'apply', 'need','description','include','people','employee']
stop_words.extend(sw_list)
5. 줄 바꿈 캐릭터 제거 ('\n')
def clean_newline(text_data):
    return text_data.replace("\\n", " ")
df['jd'] = df['job_description'].apply(clean_newline)
6,7,8,9,10,11. 클리닝 작업
import string
import re

def clean_text(text_data):
    # Metni küçük harfe çevirme
    text_data = text_data.lower()
    # Metinden URL'leri kaldırma
    text_data = re.sub(r'((www.\S+)|(https?://\S+))', r"", text_data)
    # Metinden rakamları kaldırma
   # text_data = re.sub(r'[0-9]\S+', r'', text_data)
    # Metinden etiketleri kaldırma
    text_data = re.sub(r'(@\S+) | (#\S+)', r'', text_data)
    # Noktalama işaretlerini kaldırma ve boşluk eklemek
    text_data = ''.join([char if char not in string.punctuation else ' ' for char in text_data])
    # Liste öğelerini birleştirme ve boşluk eklemek
    text_data = " ".join(text_data.split())
    # Stop words setini kullanarak stop words'leri kaldırma
    text_data = " ".join([word for word in text_data.split() if word.lower() not in stop_words])
    return text_data

df['jd'] = df['jd'].apply(clean_text)
12. 이모지 제거
def remove_emojis(text):
    return emoji.replace_emoji(text, replace='')

df['jd'] = df['jd'].apply(remove_emojis)
- 이제 Gensim의 `simple_preprocess`를 사용하여 문장을 단어로 변환할 것입니다.
# Gensim
import gensim, spacy, logging, warnings
import gensim.corpora as corpora
# from gensim.utils import lemmatize, simple_preprocess
from gensim.utils import simple_preprocess
from gensim.models import CoherenceModel # to measure performance we use this model
import matplotlib.pyplot as plt

def sent_to_words(sentences):
    for sent in sentences:
        sent = gensim.utils.simple_preprocess(str(sent), deacc=True)
        yield(sent)

# Convert to list
data = df.jd.values.tolist()

data_words = list(sent_to_words(data))data_words[['project',
'manager',
'leading',
'innovative',
'technologies',
'systems',
'shah',
'alam',
'subang',
'posted',
'jan',
'highlights',
'yearly',
'bonuses',
'salary',
'increment',
'recognition',
'award',
'annual',
이렇게 문장에 나오는 단어들을 리스트로 만들었습니다.
그다음, 데이터를 각 나라별로 필터링하여 저장했습니다.
m_df_4 = df[df['country'] == 'Malaysia']
s_df_4 = df[df['country'] == 'Singapore']
p_df_4 = df[df['country'] == 'Philippines']
i_df_4 = df[df['country'] == 'Indonesia']
m_df_4.to_csv("m_4.csv")
s_df_4.to_csv("s_4.csv")
p_df_4.to_csv("p_4.csv")
i_df_4.to_csv("i_4.csv")
이렇게 데이터 전처리 작업을 마쳤습니다.
- 이후 프로젝트의 핵심 단계로 넘어가, 필요한 라이브러리들을 import 하고 4개의 전처리된 데이터셋을 불러왔습니다.
import pandas as pd
import numpy as np
import re
import spacy
import nltk
from nltk.corpus import stopwords
nltk.download('stopwords')

import plotly.express as px


i_df = pd.read_csv("i_4.csv")
m_df = pd.read_csv("m_4.csv")
s_df = pd.read_csv("s_4.csv")
p_df = pd.read_csv("p_4.csv")
- 채용 공고에서 4차 산업혁명(4IR) 관련 단어들이 얼마나 포함되어 있는지 분석하고 시각화했습니다. 먼저, 4IR 관련 단어들이 정리된 논문의 리스트를 참고했으며, 여기에 synonym들을 수동으로 추가하여 map을 만들었습니다.
from collections import defaultdict

synonym_map = {
    "condition monitoring": [" cm "],
    "neural networks": ["neural nets", "artificial neural networks", " ann "],
    "data analytics": ["data analysis", "data interpretation", "data processing"],
    "machine learning": [" ml ", "automated learning", "predictive modeling"],
    "diagnosis": ["diagnostic"],
    "predictive maintenance": ["proactive maintenance", "forecasted maintenance", "preventive maintenance"],
    "genetic algorithm": [" ga ", "evolutionary algorithm", "genetic optimization"],
    "quality": [],
    "ubiquitous manufacturing": [],
    "industry 4": ["industry 4.0", "fourth industrial revolution", "industry four", "4ir", "industry 4 0", "industry 40"],
    "smart factory": ["intelligent factories", "smart factories"],
    "maintenance": [],
    "real-time": ["realtime", "real time"],
    "analytics": ["analysis"],
    "tracking": ["tracing", "monitoring", "following"],
    "sensors": ["detectors", "sensing devices", "sensor technology", "sensor"],
    "algorithm": ["algorithms", "method", "process"],
    "model": ["models"],
    "smart manufacturing": ["intelligent manufacturing", "advanced manufacturing", "digital manufacturing", "smart manufactory"],
    "design": [],
    "implementation": [],
    "fog computing": ["fog networking", "fogging"],
    "scheme": ["schema"],
    "internet of things (iot)": [" iot ", "internet-connected devices", "smart devices", "(iot)"],
    "cyber-physical production syst": ["cyber-physical production systems", "cyber-physical production system", "cpps"],
    "things": [],
    "internet": ["web", "online"],
    "energy efficiency": ["energy saving", "energy conservation"],
    "communication": ["networking"],
    "security": ["secure", "secureness"],
    "smart city": ["intelligent city", "connected city", "digital city"],
    "wireless sensor networks": [" wsn ", "wireless sensor network", "wireless sensor system", "wireless sensing systems", "sensor network", "sensor mesh network"],
    "opc ua": ["opc unified architecture", "opc unified protocol", "opc ua protocol"],
    "cyber-physical systems": ["cyber-physical system", " cps ", "integrated systems", "smart systems", "cypher physical system"],
    "logistics": ["supply chain management"],
    "products": ["goods", "merchandise", "items"],
    "digital factory": ["industry 4.0 factory", "industry 4 0 factory"],
    "engineering education": ["engineering training", "stem education"],
    "additive manufacturing": ["3d printing", "rapid prototyping", "additive fabrication"],
    "innovation": ["creativity", "invention", "novelty"],
    "firm": ["company", "business", "enterprise"],
    "uncertainty": ["ambiguity", "doubt", "indecision"],
    "strategies": [],
    "impact": ["influence", "effect"],
    "digitalisation": ["digitization", "digital adoption", "digitalization", "digital transformation"],
    "opportunities": ["chances", "possibilities"],
    "smart": [],
    "technology": [" tech ", "technological advancements"],
    "ontology": ["knowledge representation", "semantic framework", "conceptual model"],
    "education": [],
    "productivity": [],
    "maturity model": ["capability maturity model", "maturity assessment model", "organizational maturity model"],
    "agents": [],
    "artificial intelligence": [" ai "],
    "future": [],
    "virtual reality": [" vr ", "virtual world", "simulated reality"],
    "robot": ["automaton", "android"],
    "cloud": ["cloud computing", "cloud technology", "cloud services"],
    "big data": ["bigdata", "big data analytics", "big-data", "big data analysis"],
    "augmented reality": [" ar ", "enhanced reality", "mixed reality"],
    "fintech": ["financial technology", "financial innovation", "finance technology"],
    "distribution": ["supply", "delivery"],
    "digital": ["digitized", "electronic", "computerized"],
    "service": [],
    "virtual": ["simulated", "computer-generated", "artificial"],
    "blockchain": ["blockchain technology", "crypto"],
    "based": [],
    "utilization": ["usage"],
    "intelligent robot": ["smart robot", "cognitive robot", "thinking robot"],
    "field": ["domain", "sphere", "area"],
    "data": ["information", "datum"],
    "autonomous vehicle": ["self-driving vehicle", "driverless car", "automated vehicle"],
    "platform": ["framework"],
    "development": [],
    "mobile": [],
    "system": [],
    "computing": ["processing", "information processing"],
    "intelligent": []
}
4차 산업혁명(4IR)과 관련된 단어들의 워드클라우드는 다음과 같습니다:
keywords = list(synonym_map.keys())

text = ' '.join(keywords)

wordcloud = WordCloud(width=800, height=400, background_color='black', colormap='Set1').generate(text)

plt.figure(figsize=(10, 5))
plt.imshow(wordcloud, interpolation='bilinear')
#plt.title('Wordcloud for Synonym Map Keys')
plt.axis('off')
plt.show()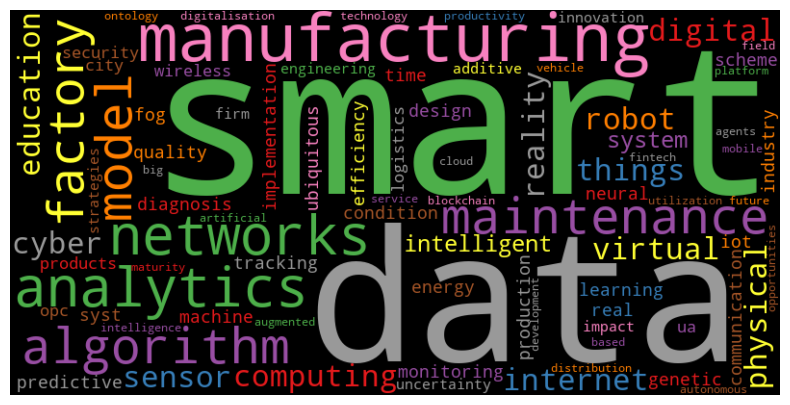
인도네시아 - 4차 산업혁명 관련 키워드 빈도 계산
keyword_counts = {w: 0 for w in synonym_map}

for keyword, synonyms in synonym_map.items():
    for jd in i_df[i_df['country'] == 'Indonesia']['jd'].str.lower():
        keyword_counts[keyword] += jd.count(keyword)
        for synonym in synonyms:
            keyword_counts[keyword] += jd.count(synonym)
in_df = pd.DataFrame.from_dict(keyword_counts, orient='index', columns=['Indonesia'])
in_df
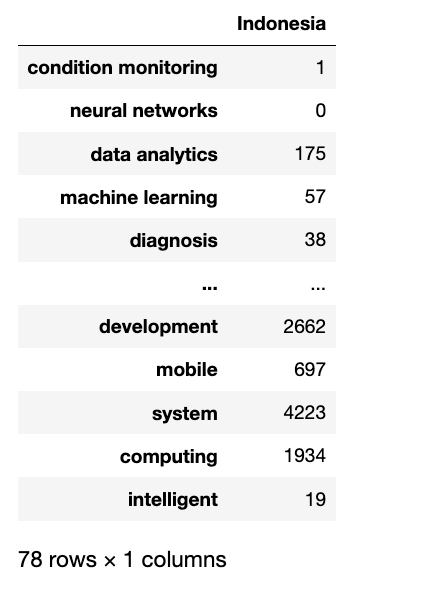
인도네시아의 각 채용 공고를 키워드에 따라 표시하고, 각 키워드가 몇 번 포함되어 있는지 계산했습니다.
keyword_counts_df = pd.DataFrame(0, index=i_df.index, columns=[keyword + '_count' for keyword in synonym_map])

for index, row in i_df.iterrows():
    for keyword, synonyms in synonym_map.items():
        count = row['jd'].lower().count(keyword)
        for synonym in synonyms:
            count += row['jd'].lower().count(synonym)
        keyword_counts_df.at[index, keyword + '_count'] = count

i_f_df = pd.concat([i_df, keyword_counts_df], axis=1)
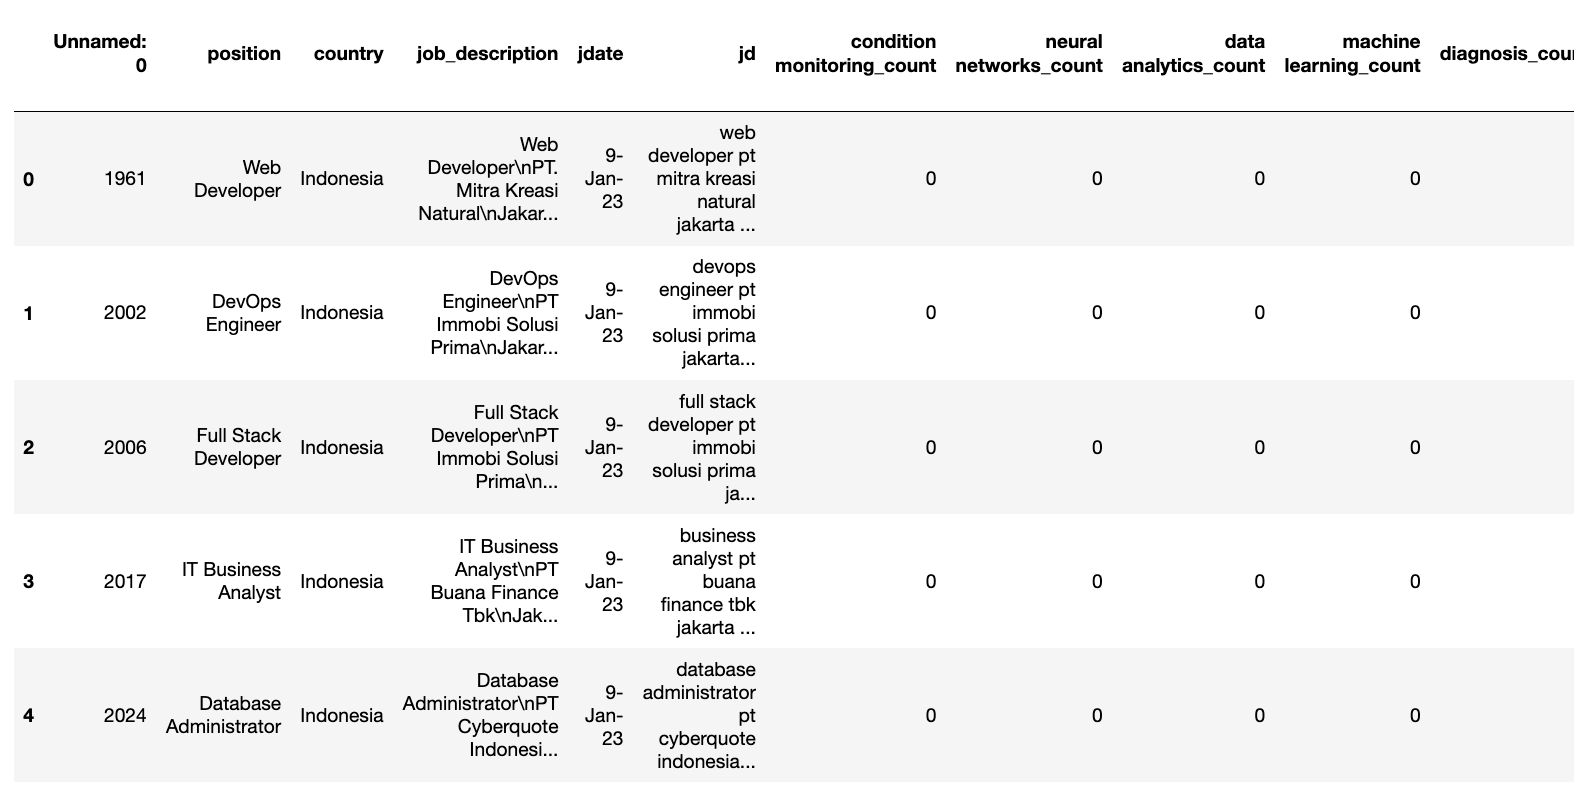
키워드가 포함된 열들만 필터링하여, 인도네시아의 키워드와 해당 빈도를 포함한 새로운 데이터를 저장했습니다.
import pandas as pd

i_f_df['total_count'] = 0
count_columns = i_f_df.columns[6:]
i_f_df['total_count'] = i_f_df[count_columns].sum(axis=1)

i_f_df.to_csv("indonesia_4irwords.csv")
- 같은 프로세스를 다른 3개 국가에 대해서도 진행하였고, 그 결과 4개 국가의 4차 산업혁명(4IR) 키워드와 각 국가의 채용 공고에서의 빈도수를 포함한 4개의 데이터셋을 얻었습니다.
- 4개 국가의 각 키워드에 대한 총 빈도 수를 합쳐서 하나의 데이터셋을 생성한 결과는 다음과 같습니다:
dfs = [in_df, ma_df, ph_df, si_df]
merged_df = pd.concat(dfs, axis=1)
merged_df.to_csv("4ir_counts_general.csv")
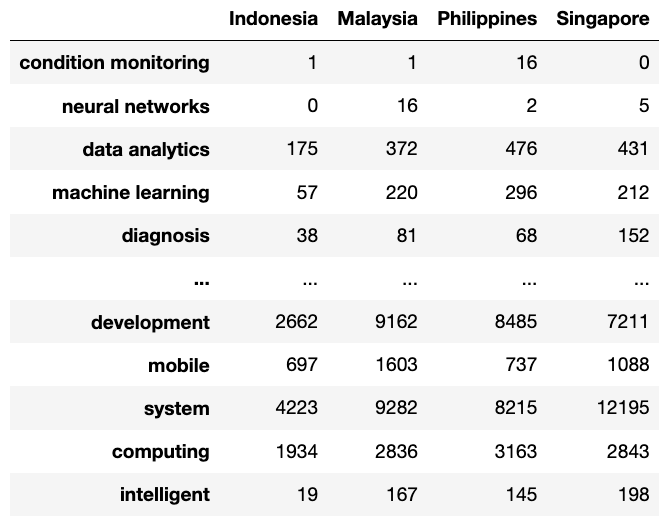
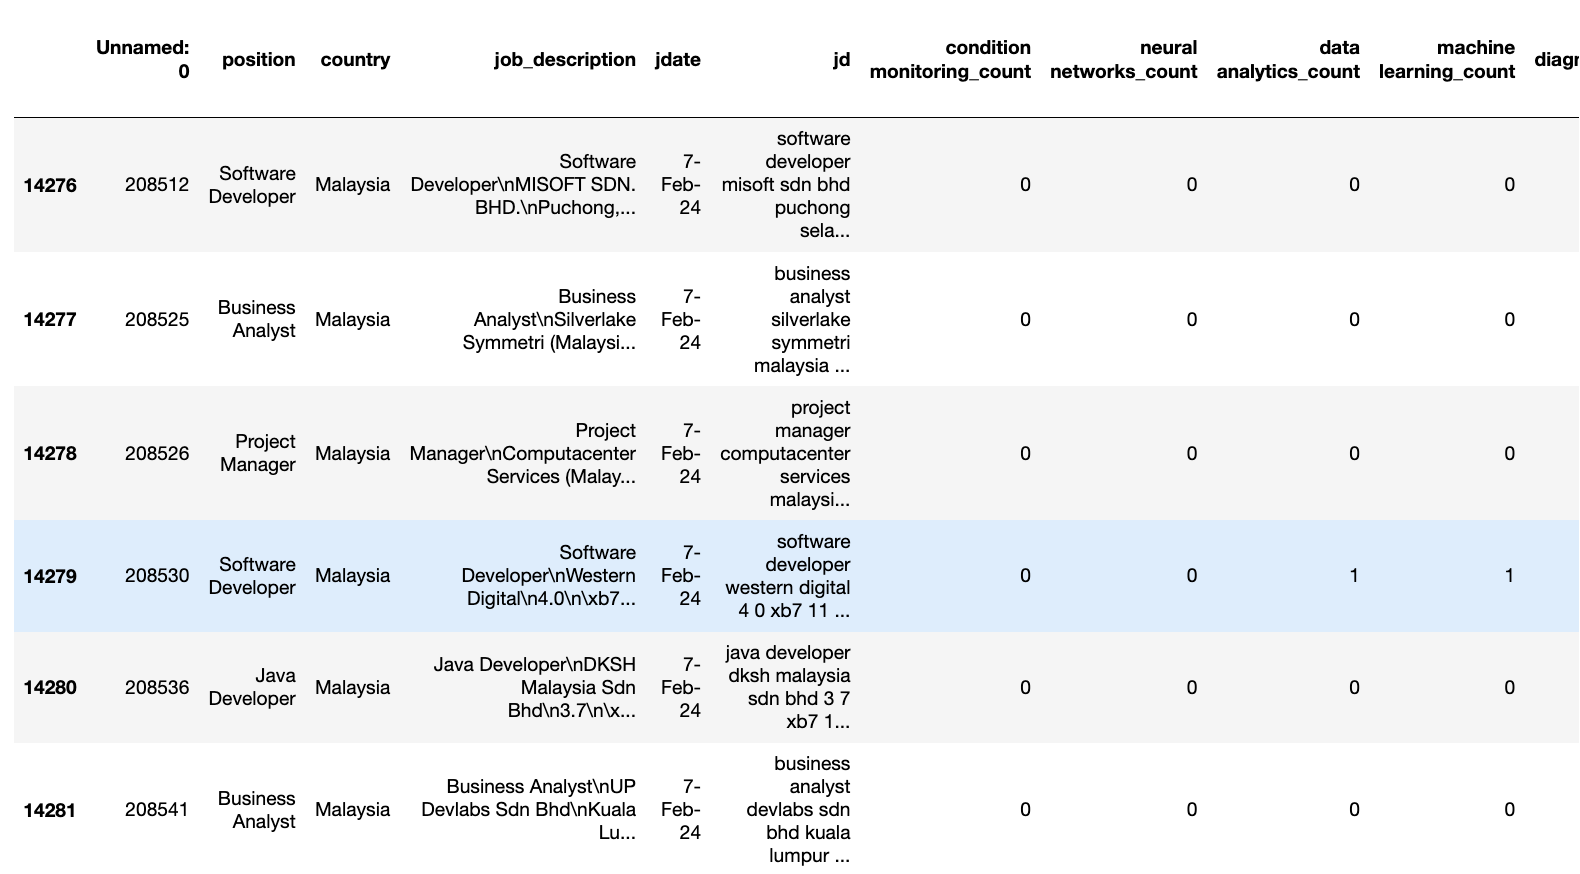
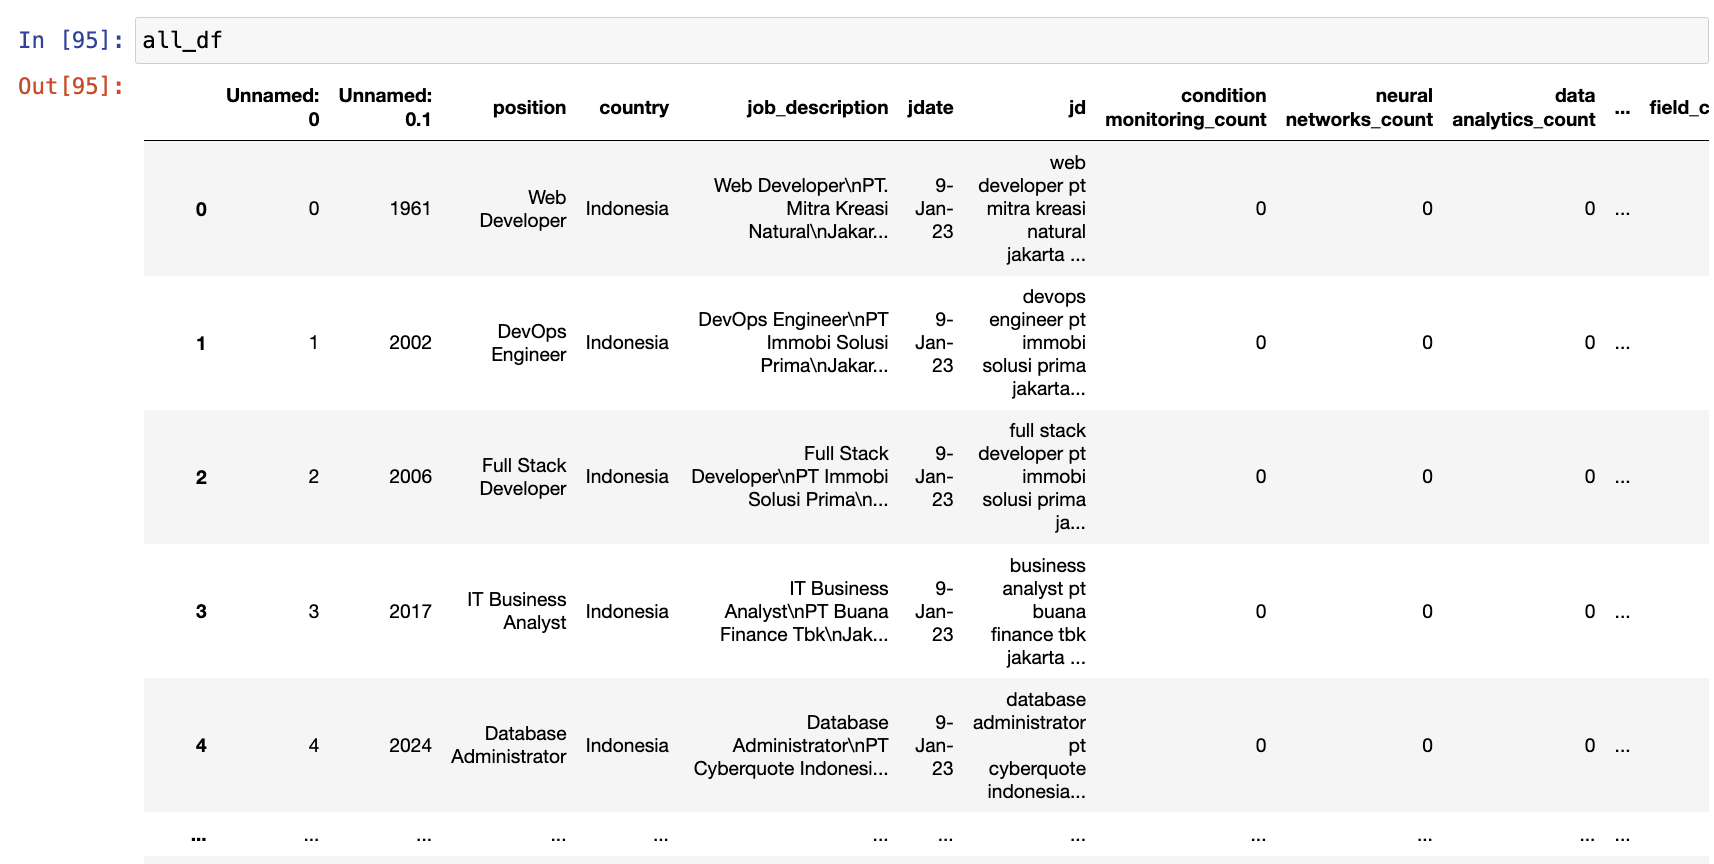
각 국가의 모든 채용 공고에서 키워드가 표시된 상태를 다음과 같이 찾고 저장했습니다.
merged_c_df = pd.concat([i_f_df, s_f_df, p_f_df, m_f_df], axis=0)
print(merged_c_df)

merged_c_df.reset_index(drop=True, inplace=True)

merged_c_df.tail(30)
merged_c_df.to_csv("all_countries_bywords.csv")
TF-IDF
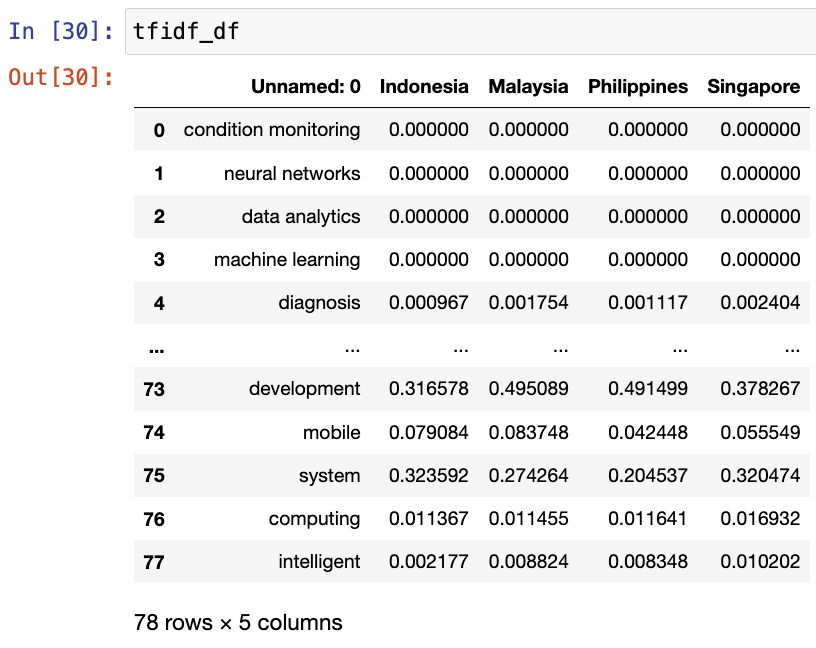
이제 이 단어들(synonym_map)의 채용 공고에서 TF-IDF 점수를 계산하겠습니다.
from sklearn.feature_extraction.text import TfidfVectorizer

indonesia_docs = ' '.join(i_df['jd'].to_list())
malaysia_docs = ' '.join(m_df['jd'].to_list())
philippines_docs = ' '.join(p_df['jd'].to_list())
singapore_docs = ' '.join(s_df['jd'].to_list())

documents = [indonesia_docs, malaysia_docs, philippines_docs, singapore_docs]


#keywords = list(synonym_map.keys())

tfidf_vectorizer = TfidfVectorizer(vocabulary=list(synonym_map))

tfidf_matrix = tfidf_vectorizer.fit_transform(documents)

tfidf_df = pd.DataFrame(tfidf_matrix.toarray(), columns=tfidf_vectorizer.get_feature_names_out(), index=['Indonesia', 'Malaysia', 'Philippines', 'Singapore'])tfidf_df.columnsIndex(['condition monitoring', 'neural networks', 'data analytics',
'machine learning', 'diagnosis', 'predictive maintenance',
'genetic algorithm', 'quality', 'ubiquitous manufacturing',
'industry 4', 'smart factory', 'maintenance', 'real-time', 'analytics',
'tracking', 'sensors', 'algorithm', 'model', 'smart manufacturing',
'design', 'implementation', 'fog computing', 'scheme',
'internet of things (iot)', 'cyber-physical production syst', 'things',
'internet', 'energy efficiency', 'communication', 'security',
'smart city', 'wireless sensor networks', 'opc ua',
'cyber-physical systems', 'logistics', 'products', 'digital factory',
'engineering education', 'additive manufacturing', 'innovation', 'firm',
'uncertainty', 'strategies', 'impact', 'digitalisation',
'opportunities', 'smart', 'technology', 'ontology', 'education',
'productivity', 'maturity model', 'agents', 'artificial intelligence',
'future', 'virtual reality', 'robot', 'cloud', 'big data',
'augmented reality', 'fintech', 'distribution', 'digital', 'service',
'virtual', 'blockchain', 'based', 'utilization', 'intelligent robot',
'field', 'data', 'autonomous vehicle', 'platform', 'development',
'mobile', 'system', 'computing', 'intelligent'],
dtype='object')tfidf_df
tfidf_df = tfidf_df.Ttfidf_df.to_csv("tfidf_4ir.csv")
시각화
이전에 저장한 세 개의 데이터셋을 사용하여 시각화를 할 것입니다.
import pandas as pd
import numpy as np
import plotly.express as px

freq_df = pd.read_csv("4ir_counts_general.csv")
all_df = pd.read_csv("all_countries_bywords.csv")
tfidf_df = pd.read_csv("tfidf_4ir.csv")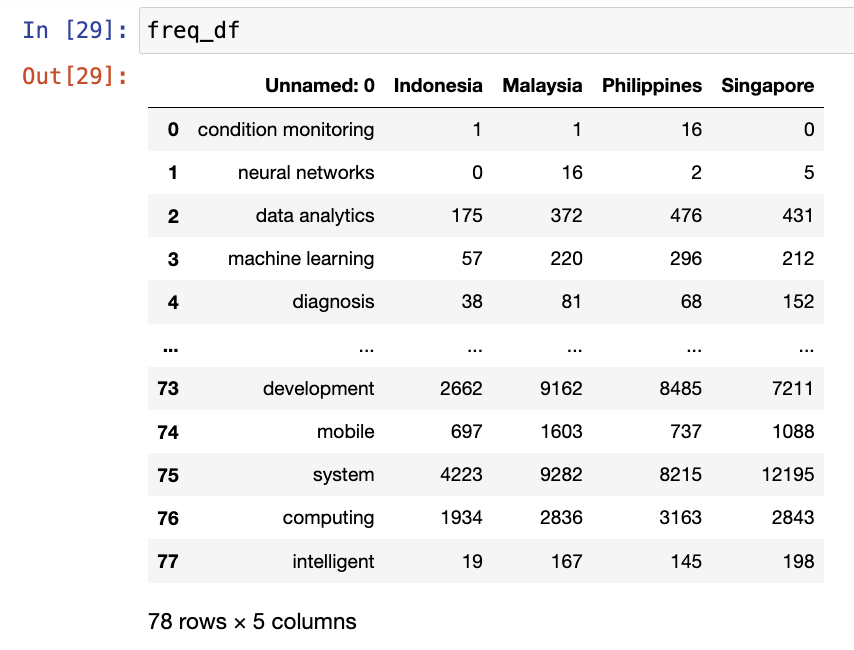 |
 |
 |
# Changing the column names
freq_df.columns = freq_df.columns.str.replace('Unnamed: 0', 'Keywords')
totals = freq_df[['Indonesia', 'Malaysia', 'Philippines', 'Singapore']].sum()
fig = px.pie(totals, names=totals.index, values=totals.values, title='Total 4IR Related Keywords - By Countries', width=500, height=400)
fig.show()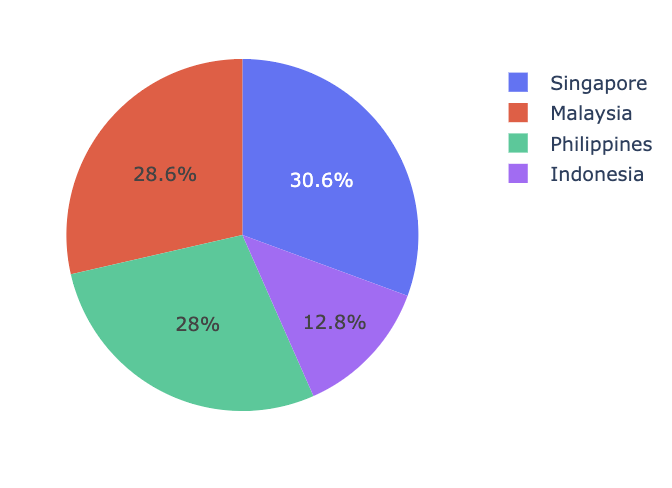
- 위의 그래픽을 보면, 싱가포르는 채용 공고에서 4IR(4차 산업 혁명) 관련 키워드가 30.6%로 가장 높은 비율을 차지하고 있으며, 이는 첨단 기술과 혁신에 대한 강한 관심을 나타냅니다. 말레이시아(28.6%)와 필리핀(28%)도 4IR 기술에 큰 집중을 보이고 있지만, 인도네시아는 12.8%로 가장 낮은 비율을 기록하며 4IR 기술에 대한 강조가 비교적 적다는 것을 보여줍니다.
- 다음 그래프에서는 각 나라에서 가장 많이 사용된 4IR 관련 키워드 20개를 시각화했습니다. 예상대로, "데이터"는 모든 나라에서 가장 자주 등장하는 키워드로, 기술 분야 채용 공고에서 그 중요성을 나타냅니다. "기업"이 모든 나라에서 두 번째로 많이 사용된 키워드로 나타났습니다. 인도네시아와 말레이시아에서는 "기술"이 세 번째로, 싱가포르에서는 "시스템", 필리핀에서는 "서비스"가 세 번째로 자주 언급되었습니다.
특히 싱가포르는 "보안" 키워드가 다른 나라들에 비해 더 높은 순위에 올라, 보안에 대한 높은 우선순위를 보여줍니다.
def get_top_n_words(df, country, n=20):
    top_n_words = df[['Keywords', country]].nlargest(n, country)
    return top_n_words

color_palettes = ['Red', 'Green', 'Blue', 'Orange']
countries = ['Indonesia', 'Malaysia', 'Philippines', 'Singapore']

for country, color_palette in zip(countries, color_palettes):
    top_words = get_top_n_words(freq_df, country)
    fig = px.bar(top_words, x='Keywords', y=country, title=f'{country} - Top 20 Keywords',
                 color='Keywords', color_discrete_sequence=px.colors.qualitative.Bold)
    fig.update_layout(showlegend=False)
    fig.show()
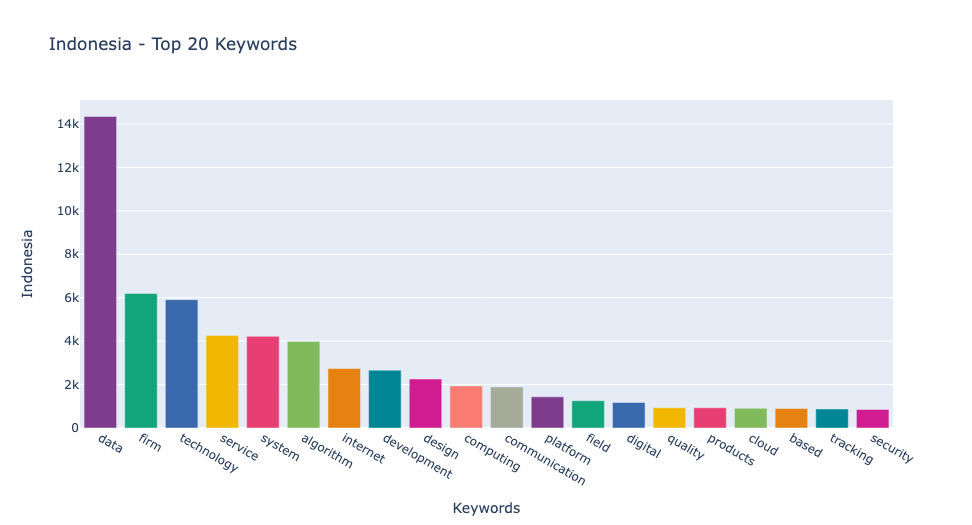
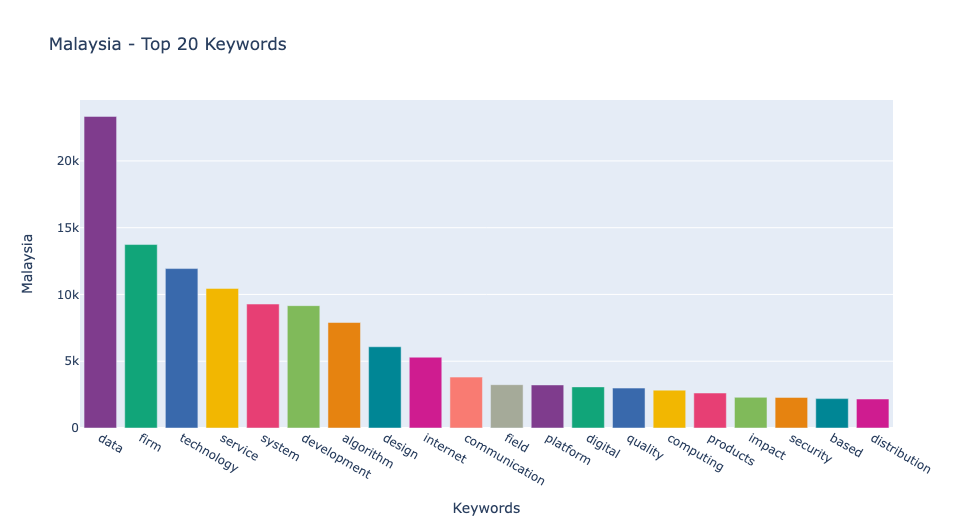

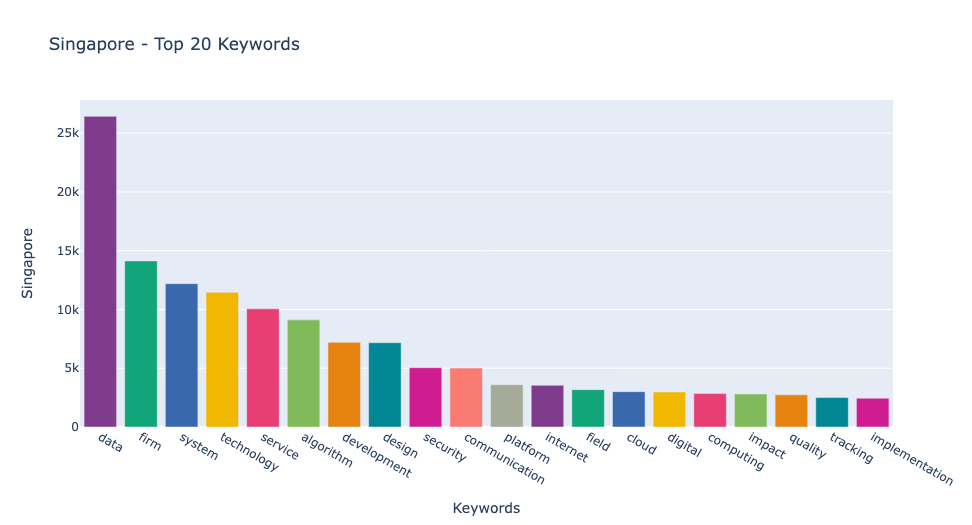
- 네 개의 나라에 대해 각 나라에서 가장 많이 사용된 20개의 키워드의 빈도를 살펴보겠습니다. 이 분석을 통해 각 나라의 기술 분야에서의 초점과 요구되는 스킬을 더 잘 이해할 수 있습니다. 특히 "데이터, " "기업, " "기술, " "시스템, " "서비스"와 같은 키워드의 빈도는 각 나라의 노동 시장의 필요를 이해하는 데 중요한 정보를 제공합니다.
top_keywords_by_country = {country: freq_df.nlargest(20, country)['Keywords'].tolist() for country in countries}

all_top_keywords = set().union(*top_keywords_by_country.values())

top_20_keywords = list(all_top_keywords)[:20]

freq_long_df = freq_df.melt(id_vars=["Keywords"], value_vars=["Indonesia", "Malaysia", "Philippines", "Singapore"], var_name="Country", value_name="Frequency")
freq_long_df = freq_long_df[freq_long_df["Keywords"].isin(top_20_keywords)]

freq_long_df = freq_long_df.sort_values(by=["Country", "Frequency"], ascending=[True, False])
fig = px.bar(freq_long_df,
             x="Frequency",
             y="Keywords",
             color="Country",
             orientation='h',
             title="Keyword Frequencies by Countries (Top 20)",
             labels={"Keywords": "Keyword", "Frequency": "Frequency", "Country": "Country"},
            )
fig.show()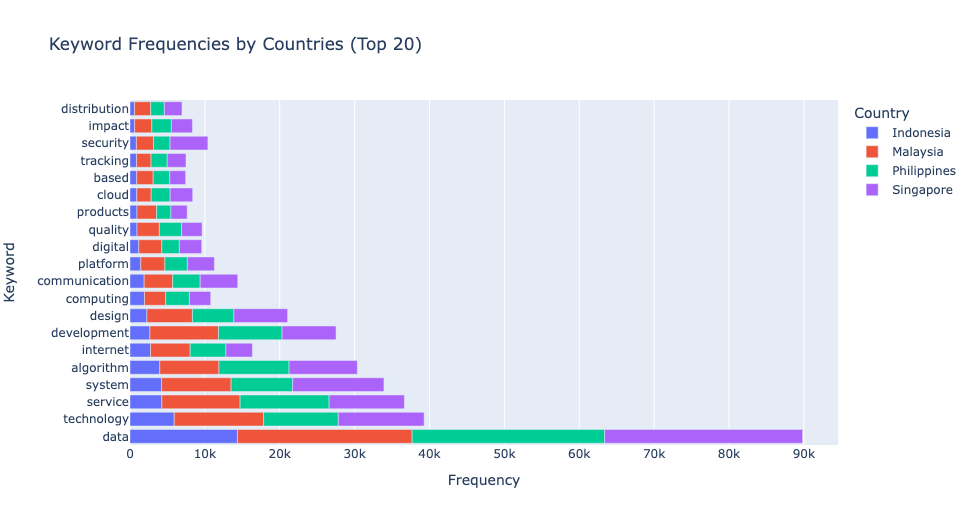
all_df = all_df.drop(['Unnamed: 0', 'Unnamed: 0.1'], axis=1)
all_df.drop_duplicates(inplace=True)
각 나라의 빈도 분석
인도네시아
i_df = all_df[all_df['country'] == 'Indonesia']
m_df = all_df[all_df['country'] == 'Malaysia']
p_df = all_df[all_df['country'] == 'Philippines']
s_df = all_df[all_df['country'] == 'Singapore']

i_df['jdate'] = pd.to_datetime(i_df['jdate'], format='%d-%b-%y')
i_df['year_month'] = i_df['jdate'].dt.to_period('M').astype(str)
monthly_i = i_df.groupby('year_month')['total_count'].sum().reset_index()
fig = px.line(monthly_i, x='year_month', y='total_count',
title='4IR Monthly Total Keyword Counts',
labels={'year_month': 'Month-Year', 'total_count': 'Total Keyword Count'},
color_discrete_sequence=px.colors.qualitative.Bold)
fig.update_xaxes(tickformat='%Y-%m')
fig.show()
싱가포르
s_df['jdate'] = pd.to_datetime(s_df['jdate'], format='%d-%b-%y')

s_df['year_month'] = s_df['jdate'].dt.to_period('M').astype(str)

monthly_s = s_df.groupby('year_month')['total_count'].sum().reset_index()
monthly_s
fig = px.line(monthly_s, x='year_month', y='total_count',
title='4IR Monthly Total Keyword Counts',
labels={'year_month': 'Month-Year', 'total_count': 'Total Keyword Count'},
color_discrete_sequence=px.colors.qualitative.Bold)
fig.update_xaxes(tickformat='%Y-%m')
fig.show()
말레시아
m_df['jdate'] = pd.to_datetime(m_df['jdate'], format='%d-%b-%y')

m_df['year_month'] = m_df['jdate'].dt.to_period('M').astype(str)

monthly_m = m_df.groupby('year_month')['total_count'].sum().reset_index()
monthly_m
fig = px.line(monthly_m, x='year_month', y='total_count',
title='4IR Monthly Total Keyword Counts',
labels={'year_month': 'Month-Year', 'total_count': 'Total Keyword Count'},
color_discrete_sequence=px.colors.qualitative.Bold)
fig.update_xaxes(tickformat='%Y-%m')
fig.show()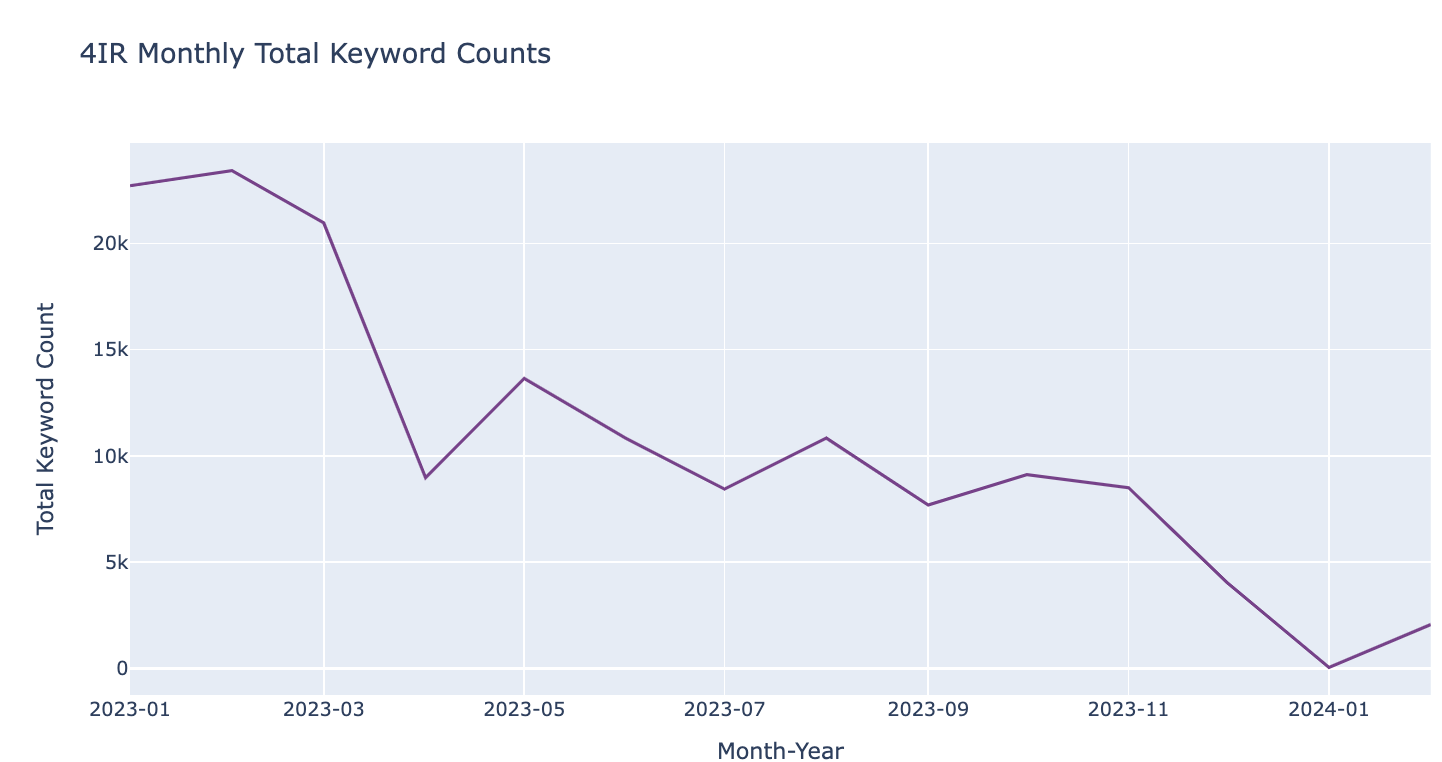
필리핀
p_df['jdate'] = pd.to_datetime(p_df['jdate'], format='%d-%b-%y')

p_df['year_month'] = p_df['jdate'].dt.to_period('M').astype(str)

monthly_p = p_df.groupby('year_month')['total_count'].sum().reset_index()
monthly_p
fig = px.line(monthly_p, x='year_month', y='total_count',
title='4IR Monthly Total Keyword Counts',
labels={'year_month': 'Month-Year', 'total_count': 'Total Keyword Count'},
color_discrete_sequence=px.colors.qualitative.Bold)
fig.update_xaxes(tickformat='%Y-%m')
fig.show()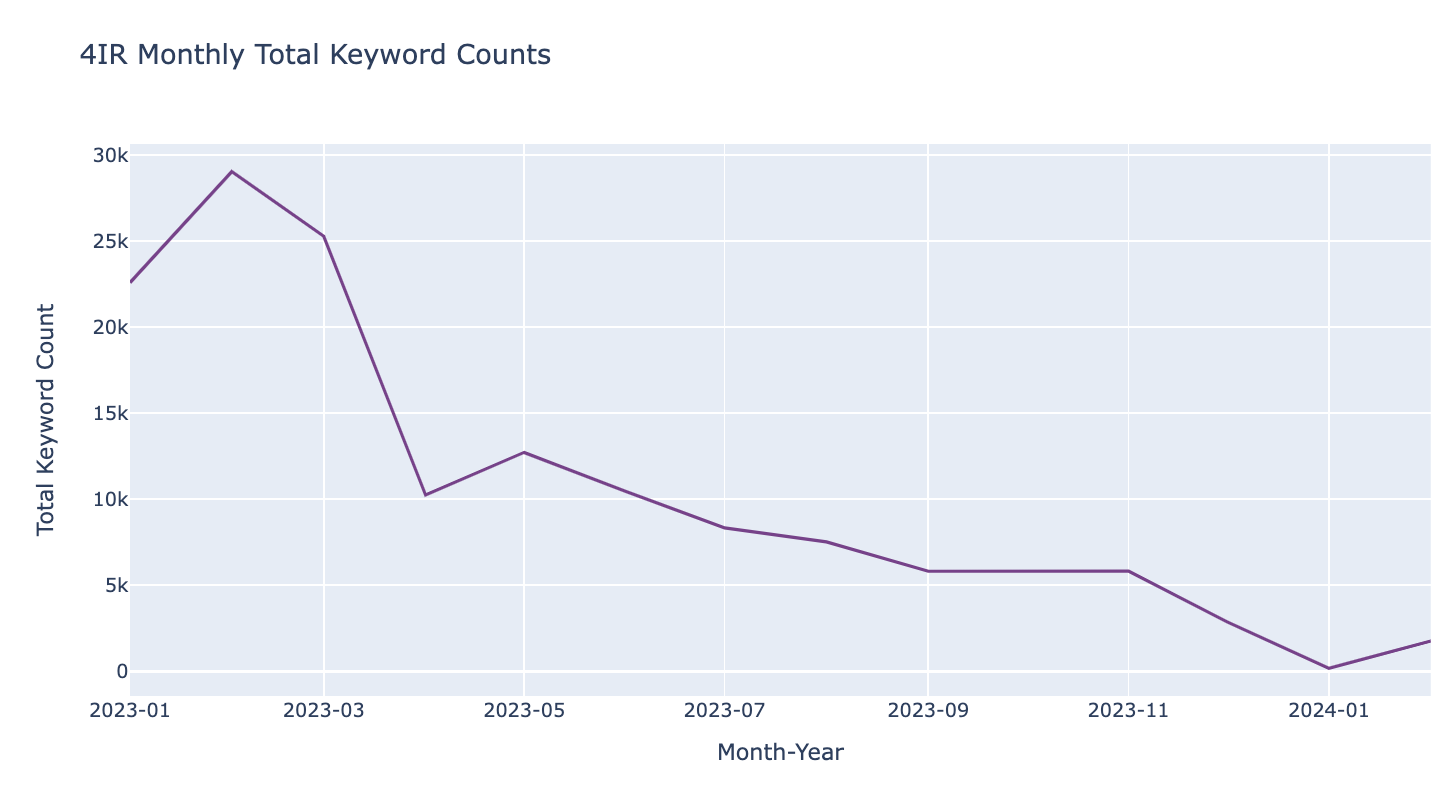
all_monthly = pd.concat([monthly_p, monthly_i, monthly_s, monthly_m], keys=['Philippines', 'Indonesia', 'Singapore', 'Malaysia'])

fig = px.line(all_monthly.reset_index(), x='year_month', y='total_count', color='level_0',
              title='Monthly Total Keyword Counts by Country', labels={'year_month': 'Month-Year', 'total_count': 'Total Keyword Count', 'level_0': 'Country'})
fig.update_xaxes(tickformat='%Y-%m')

fig.show()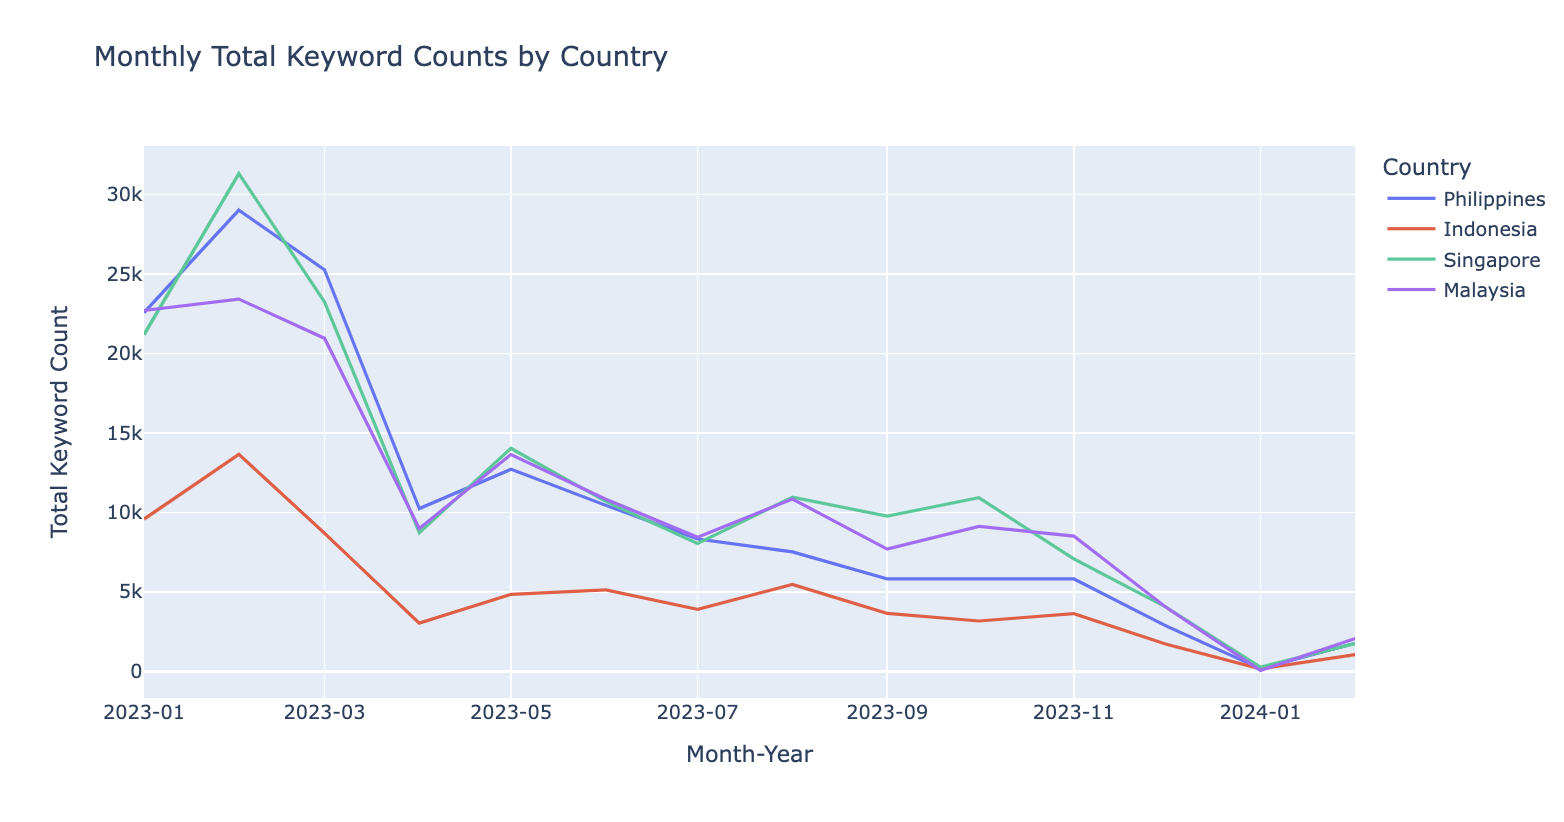
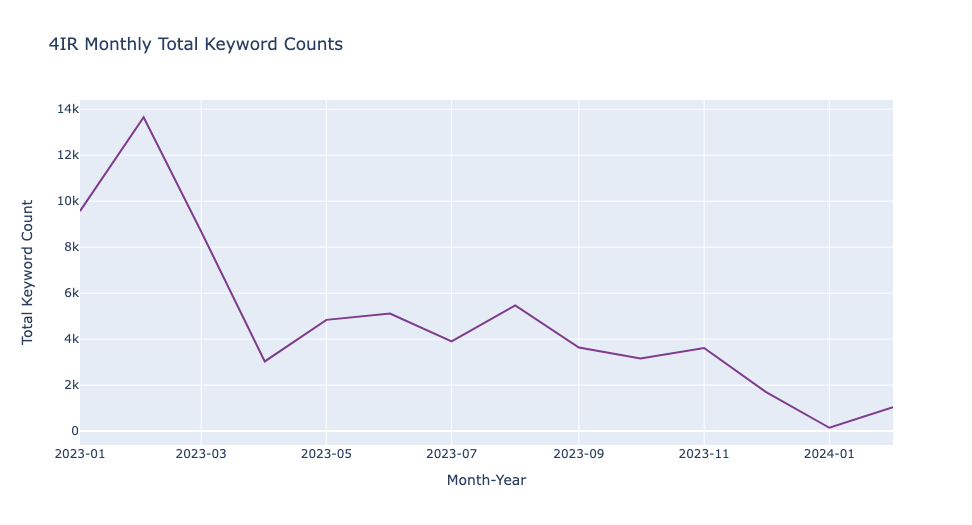
- 2023년 1월부터 2024년 2월까지의 기간 동안 각 나라의 채용 광고에서 4IR 관련 키워드 수의 변화를 월별로 시각화하였습니다. 이 데이터를 통해 각 나라 간의 차이를 살펴보려 했습니다.
그래프에서 보듯, 2023년 2월은 모든 나라에서 키워드 수가 가장 높았으며, 이는 총 39,218개의 채용 공고가 있었기 때문입니다. 일반적으로 1월과 2월에 채용 활동이 둔화될 것이라는 예상이 있지만, 실제로는 올해 초 많은 기업들이 새로운 인재를 찾고 있다는 사실을 보여주었습니다.
월별로 4IR 키워드 수를 살펴보면 네 나라가 유사한 패턴을 보이며 큰 차이가 없음을 알 수 있었습니다. 이는 각 나라가 비슷한 트렌드를 경험하고 있으며, 4IR 기술에 대한 지속적인 수요가 있음을 나타냅니다.
'텍스트마이닝' 카테고리의 다른 글
| 쿠팡 앱 리뷰 토픽모델링 분석 (29) | 2024.09.21 |
|---|---|
| BERTopic과 인과분석: 정신 건강 문제에 영향을 미치는 요인 탐색 (4) | 2024.08.26 |
| 'HelloTalk' 앱 리뷰 감성분석 | Sentiment Analysis using NRC Emotion Lexicon and GoEmotions Dataset [Part 2] (9) | 2024.08.07 |
| 'HelloTalk' 앱 리뷰 토픽모델링 | Topic Modeling LDA [Part 1] (8) | 2024.07.08 |
| 감성분석 Sentiment Analysis - [Amazon Sales Data] (8) | 2024.05.09 |


