| 일 | 월 | 화 | 수 | 목 | 금 | 토 |
|---|---|---|---|---|---|---|
| 1 | 2 | 3 | ||||
| 4 | 5 | 6 | 7 | 8 | 9 | 10 |
| 11 | 12 | 13 | 14 | 15 | 16 | 17 |
| 18 | 19 | 20 | 21 | 22 | 23 | 24 |
| 25 | 26 | 27 | 28 | 29 | 30 | 31 |
- pythonlearner
- 데이터분석
- 오블완
- nrcemotionlexicon
- 커스텀오퍼레이터
- htmltags
- 인과분석
- llma
- 파이썬러너
- LDA
- 머신러닝
- customoperator
- 텍스트마이닝
- causalanalysis
- 래피드마이너
- datacrawling
- RapidMiner
- 올라마
- 토픽모델링
- agglomerative clustering
- GoEmotions
- 채용공고분석
- customeoperator
- 감성분석
- featureimportance
- sentimentanalysis
- 데이터크롤링
- 티스토리챌린지
- 데이터
- 통계개념
- Today
- Total
마이와 텍스트마이닝
서울 자전거 대여 수요 이해하기: 머신러닝 접근법 [회귀분석] 본문
안녕하세요!
오늘은 서울 공공 자전거 데이터를 활용하여 회귀 분석을 통해 자전거 대여 수를 예측하는 프로젝트를 진행하겠습니다. 서울은 자전거 대여 시스템을 통해 시민들에게 편리한 교통 수단을 제공하고 있으며, 이 데이터는 자전거 대여의 패턴과 영향을 미치는 다양한 요인을 이해하는 데 도움을 줄 것입니다.
분석을 시작하기 전에 몇 가지 중요한 요소를 그래픽으로 보여드리겠습니다. 그 후, 자전거 대여 수를 세 가지 다른 머신러닝 알고리즘을 사용하여 실험하고 성능을 비교하겠습니다. 마지막으로, 가장 좋은 성능을 보인 알고리즘의 특징 중요도를 분석하여 자전거 대여 수에 영향을 미치는 가장 중요한 요소들을 이해하려고 합니다. 그럼 바로 시작하시지오~!
데이터:
import pandas as pd
import numpy as np
import plotly.express as px

# Reading the data
df = pd.read_csv("SeoulBikeData.csv", encoding='latin1')

df.head()
- 더 잘 이해하기 위해 'Hour' 열을 기준으로 Morning, Afternoon, Evening으로 레이블을 지정하겠습니다.
# Creating a new column for Time of Day based on the existing 'Hour' column
def categorize_time(hour):
    if 6 <= hour < 12:
        return 'Morning'
    elif 12 <= hour < 18:
        return 'Afternoon'
    else:
        return 'Evening'

# Apply the function to categorize time
df['Time of Day'] = df['Hour'].apply(categorize_time)
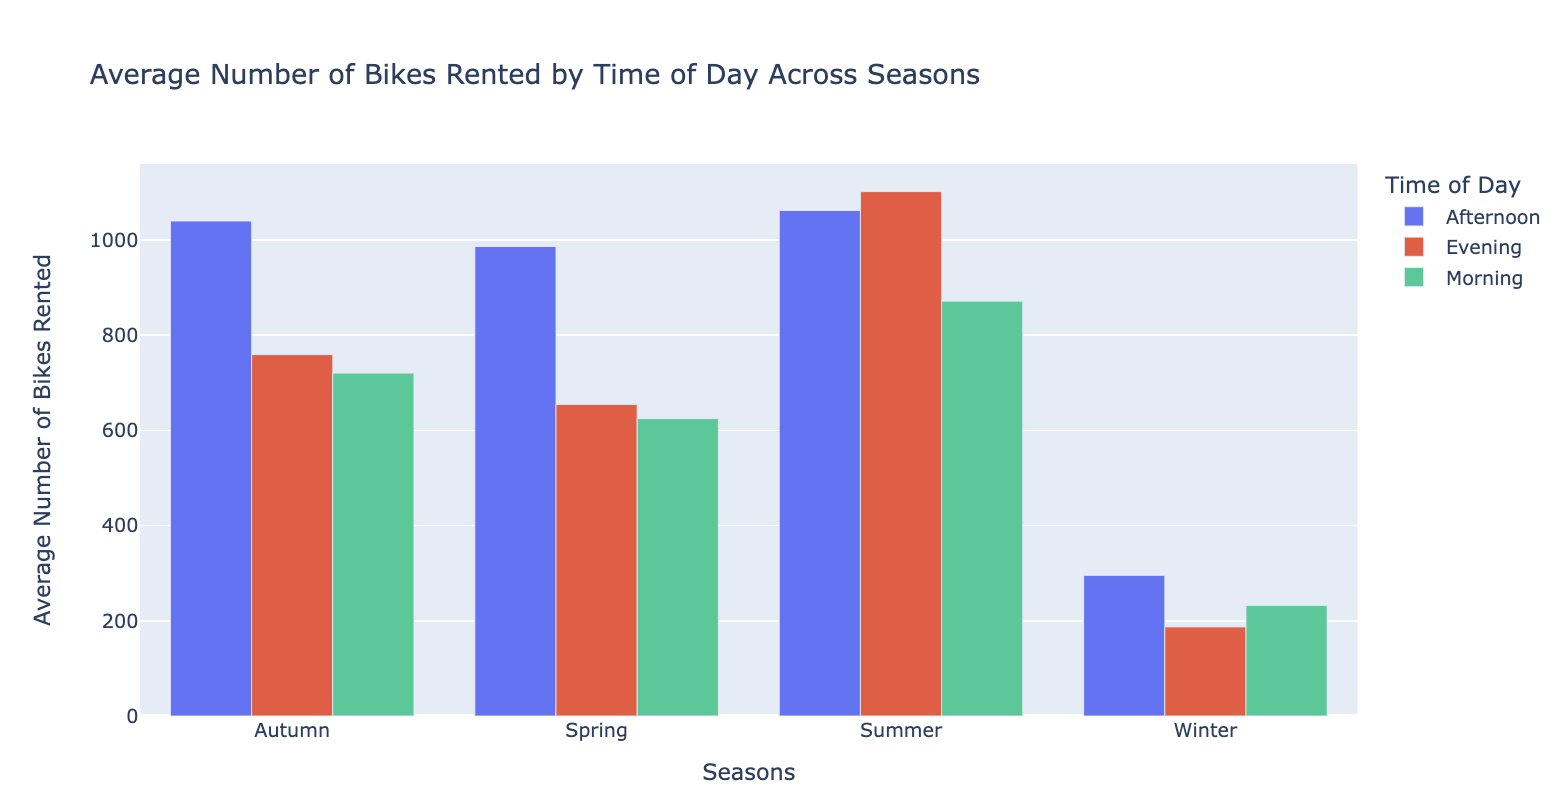
1. 시간대별 계절에 따른 자전거 대여 수의 평균
* 여름 저녁에 자전거 대여가 가장 많이 이루어지고 있음을 알 수 있습니다.
avg_bikes = df.groupby(['Seasons', 'Time of Day'])['Rented Bike Count'].mean().reset_index()

# 5. Plotting the results using Plotly
fig = px.bar(avg_bikes,
              x='Seasons',
              y='Rented Bike Count',
              color='Time of Day',
              title='Average Number of Bikes Rented by Time of Day Across Seasons',
              labels={'Rented Bike Count': 'Average Number of Bikes Rented'},
              barmode='group')

# Show the plot
fig.show()
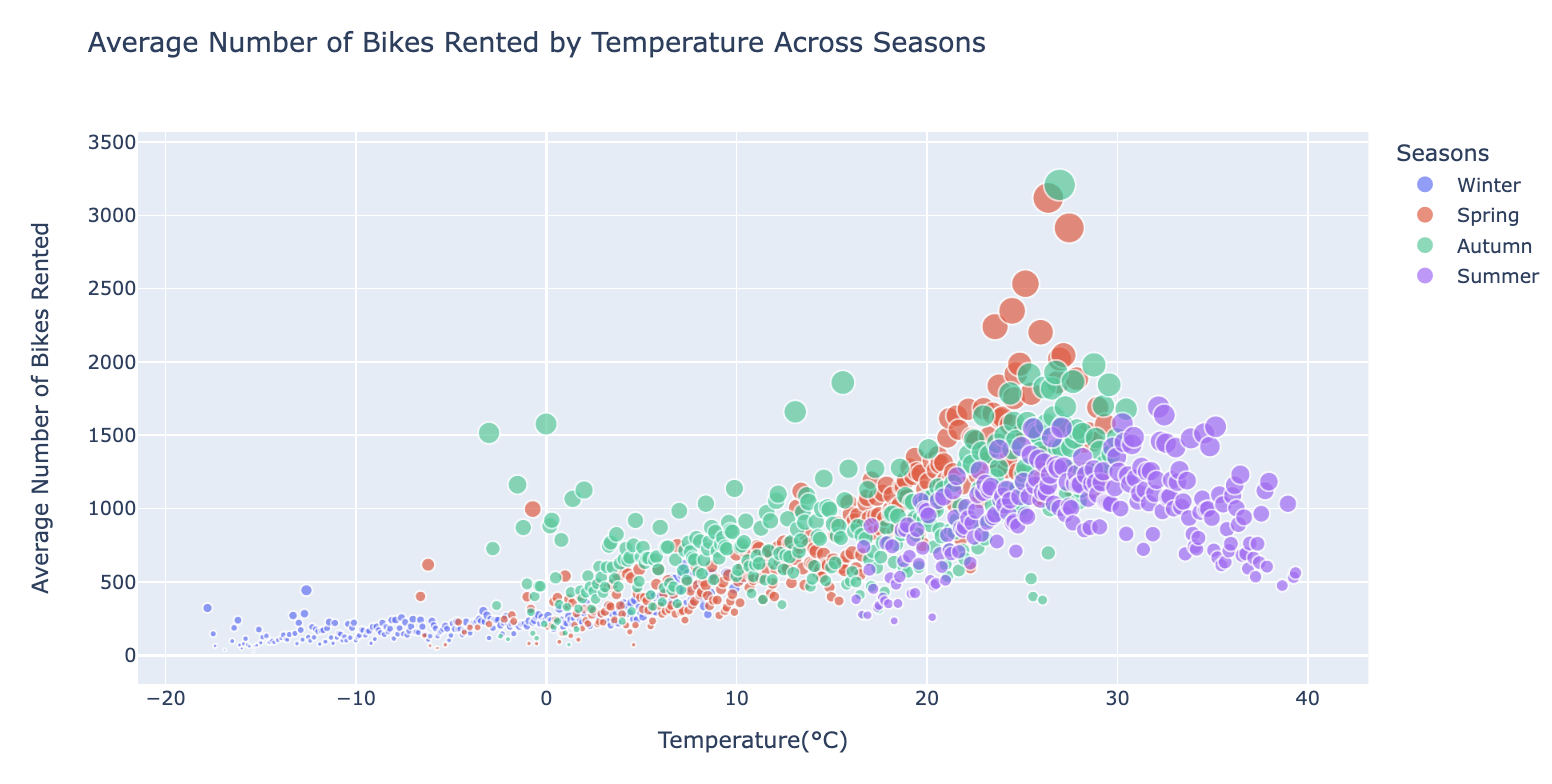
2. 계절별 온도에 따른 평균 자전거 대여 수
# Plotting the results using Plotly with a scatter plot
temp_bikes = df.groupby(['Temperature(°C)', 'Seasons'])['Rented Bike Count'].mean().reset_index()
fig = px.scatter(temp_bikes,
                 x='Temperature(°C)',
                 y='Rented Bike Count',
                 color='Seasons',
                 title='Average Number of Bikes Rented by Temperature Across Seasons',
                 labels={'Rented Bike Count': 'Average Number of Bikes Rented'},
                 size='Rented Bike Count',  # Size can be based on number of bikes rented
                 hover_name='Seasons')  # Display the season when hovering

fig.show()
* 그래프에서 볼 수 있듯이, 더 따뜻한 계절, 즉 온도가 높아질수록 자전거 대여 수가 증가하고 있습니다.
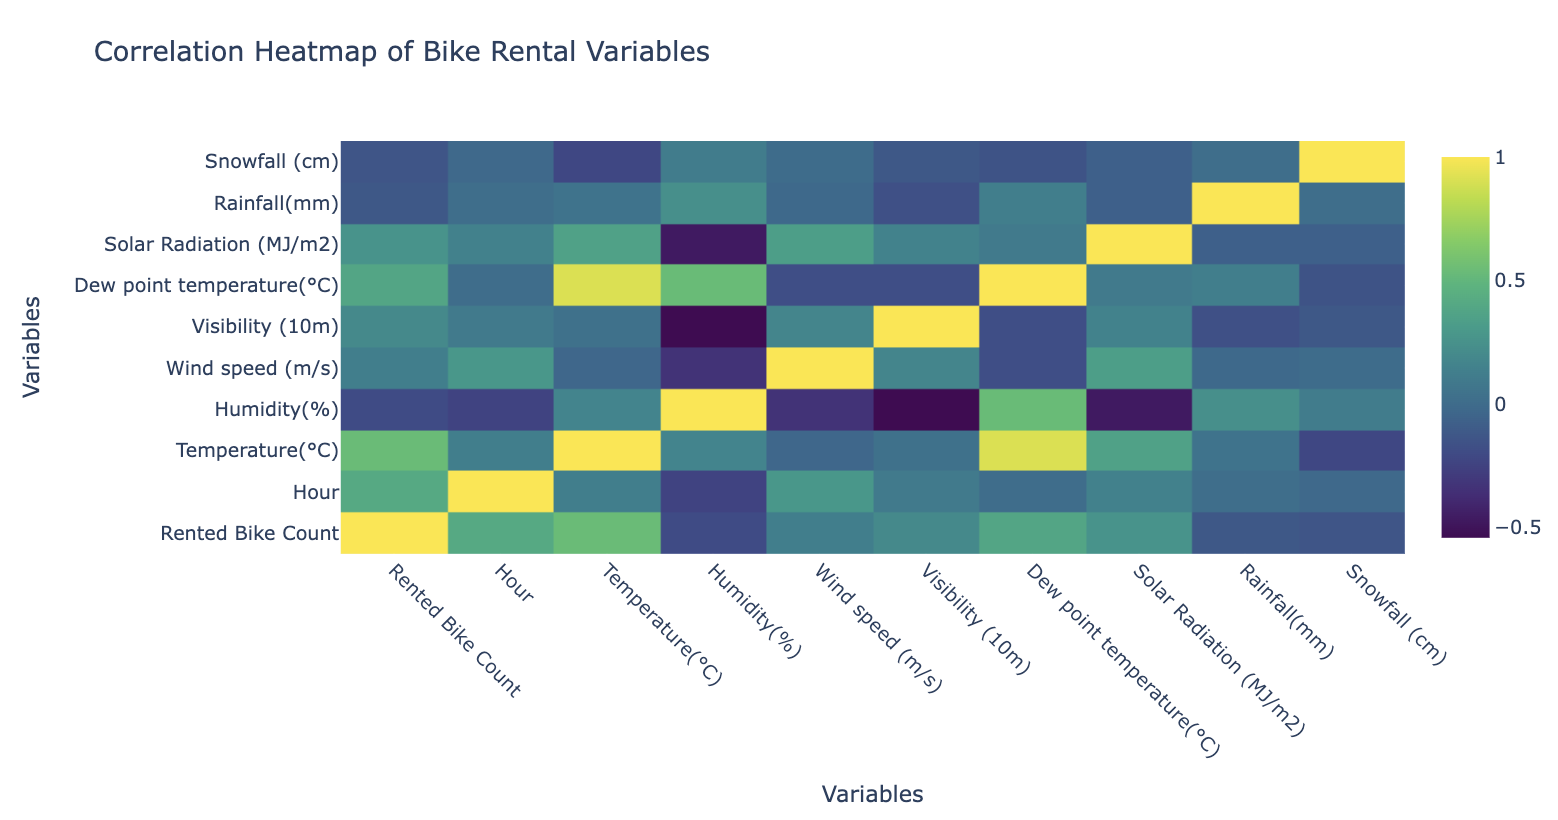
3. 자전거 대여 변수의 상관 관계 히트맵
correlation_matrix = df.corr()
import plotly.graph_objects as go
fig = go.Figure(data=go.Heatmap(
                   z=correlation_matrix.values,
                   x=correlation_matrix.columns,
                   y=correlation_matrix.index,
                   colorscale='Viridis'))
fig.update_layout(title='Correlation Heatmap of Bike Rental Variables',
                  xaxis_title='Variables',
                  yaxis_title='Variables',
                  xaxis=dict(tickangle=45))
fig.show()
bike_rented_corr = correlation_matrix['Rented Bike Count'].sort_values(ascending=False)
print(bike_rented_corr)
Rented Bike Count 1.000000
Temperature(°C) 0.538558
Hour 0.410257
Dew point temperature(°C) 0.379788
Solar Radiation (MJ/m2) 0.261837
Visibility (10m) 0.199280
Wind speed (m/s) 0.121108
Rainfall(mm) -0.123074
Snowfall (cm) -0.141804
Humidity(%) -0.199780
Name: Rented Bike Count, dtype: float64
- 이 상관관계 결과를 바탕으로 "대여 자전거 수(Rented Bike Count)"와 다른 변수들 간의 관계를 분석할 수 있습니다. 결과는 대여 자전거 수가 특히 온도와 시간과 같은 변수에 의해 어떻게 영향을 받는지를 보여줍니다. 또한, 날씨 조건(비, 눈)과 같은 요인들도 대여 행동에 중요한 영향을 미칩니다. 이러한 분석은 자전거 대여 서비스를 제공하는 회사들이 전략적 결정을 내리는 데 유용할 수 있으며, 예를 들어, 더운 날에는 프로모션을 진행하거나 비 오는 날에는 대여 시간을 줄이는 등의 방법을 고려할 수 있습니다.
- 이제 머신러닝 알고리즘을 사용하여 대여 자전거 수("Rented Bike Count")에 대한 회귀 분석을 수행할 것입니다. 이를 위해 먼저 결측치(missing values)를 확인해 보겠습니다.
# Checking missing values
df.isnull().sum()
Date 0
Rented Bike Count 0
Hour 0
Temperature(°C) 0
Humidity(%) 0
Wind speed (m/s) 0
Visibility (10m) 0
Dew point temperature(°C) 0
Solar Radiation (MJ/m2) 0
Rainfall(mm) 0
Snowfall (cm) 0
Seasons 0
Holiday 0
Functioning Day 0
Time of Day 0
dtype: int64
결측치가 없습니다!~ 이제 범주형 변수(categorical variables)에 대해 원-핫 인코딩(One-Hot Encoding)을 수행하겠습니다. 원-핫 인코딩은 범주형 데이터를 머신러닝 알고리즘이 이해할 수 있는 형식으로 변환하는 방법입니다.
One-Hot Encoding
df_encoded = pd.get_dummies(df, columns=['Seasons'], prefix='Season')
df_encoded = pd.get_dummies(df_encoded, columns=['Holiday'], prefix='Holiday')
df_encoded = pd.get_dummies(df_encoded, columns=['Functioning Day'], prefix='FD')
df_encoded = pd.get_dummies(df_encoded, columns=['Time of Day'], prefix='Time_of_day')

df_encoded.head()

- 이런식으로 범주형 변수를 원-핫 인코딩으로 변환했습니다~
자전거 대여 수 예측: 모델 성능 분석
- X에는 타겟 변수인 'Rented Bike Count'와 'Date'를 제외한 모든 특성 변수가 포함되고, y에는 타겟 변수인 'Rented Bike Count'가 포함됩니다. 이후 train_test_split 함수를 사용하여 데이터셋을 학습용 데이터와 테스트용 데이터로 80:20 비율로 나누었습니다.
import pandas as pd
from sklearn.model_selection import train_test_split
from sklearn.linear_model import LinearRegression
from sklearn.tree import DecisionTreeRegressor
from sklearn.ensemble import RandomForestRegressor
from sklearn.metrics import mean_squared_error, r2_score

X = df_encoded.drop(columns=['Rented Bike Count', 'Date'])  # Excluding the target variable and date
y = df_encoded['Rented Bike Count'] # target variable

X_train, X_test, y_train, y_test = train_test_split(X, y, test_size=0.2, random_state=42)
- 그 다음에 세 가지 머신러닝 모델(선형 회귀, 결정 트리, 랜덤 포레스트)을 정의하고, 각 모델에 대해 학습 및 성능 평가를 수행하겠습니다.
# Models
models = {
    "Linear Regression": LinearRegression(),
    "Decision Tree": DecisionTreeRegressor(),
    "Random Forest": RandomForestRegressor()
}

# Model training and comparing the results
results = {}

for model_name, model in models.items():
    # Model training
    model.fit(X_train, y_train)

    # Test set prediction
    y_pred = model.predict(X_test)

    # Calculating performance metrics
    mse = mean_squared_error(y_test, y_pred)
    r2 = r2_score(y_test, y_pred)

    # Saving results
    results[model_name] = {"MSE": mse, "R2 Score": r2}

# Presenting results
results_df = pd.DataFrame(results).T
results_df.head()
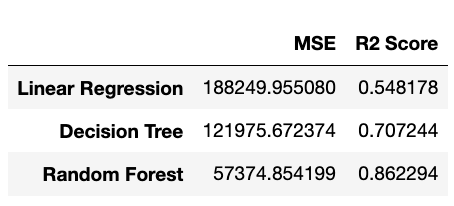
- 이 결과에 따르면, 랜덤 포레스트 모델은 평균 제곱 오차(MSE = 57374.85)와 설명력(R² = 0.86)에서 가장 우수한 성능을 보여 자전거 대여 수를 가장 잘 예측합니다. 반면, 선형 회귀 모델은 낮은 설명력(R² = 0.55)과 높은 오류(MSE = 188249.96)로 성능이 떨어지며, 결정 트리 모델은 MSE = 121975.67로 상대적으로 나은 성능을 보입니다(R² = 0.71). 랜덤 포레스트는 데이터의 86% 변화를 설명할 수 있어, 온도, 습도, 풍속 등의 외부 요인이 자전거 대여 수에 큰 영향을 미친다는 것을 나타냅니다.
마지막으로, 가장 좋은 성능을 보여준 랜덤 포레스트 회귀 모델의 feature importance를 분석하여 자전거 대여 수에 영향을 미치는 중요한 요인들을 찾아보겠습니다.
from sklearn.ensemble import RandomForestRegressor
import matplotlib.pyplot as plt

rf = RandomForestRegressor()
rf.fit(X, y)

importances = rf.feature_importances_

feature_importances = pd.DataFrame(importances, index=X.columns, columns=["Importance"]).sort_values("Importance", ascending=False)

# Plotly bar graph
fig = px.bar(feature_importances,
              x=feature_importances.index,
              y='Importance',
              title='Feature Importance',
              labels={'Importance': 'Importance Score'},
              color='Importance',
              color_continuous_scale=px.colors.sequential.Viridis)

fig.update_layout(xaxis_title='Features', yaxis_title='Importance Score')
fig.show()
- 그래프에서 알 수 있듯이, 가장 큰 영향을 미치는 요인은 온도이며, 그 다음으로 시간도 중요한 역할을 합니다. 또한, 태양 복사량과 습도도 자전거 대여 수에 영향을 미치는 중요한 요소입니다.
'머신러닝' 카테고리의 다른 글
| 고객 데이터 클러스터링: K-Means, Agglomerative Clustering, PCA를 통한 분석 (7) | 2024.11.19 |
|---|

